Red Oak Quantitative Analytics
Providing Equity Market Research & Analysis
The Wave-State Theory
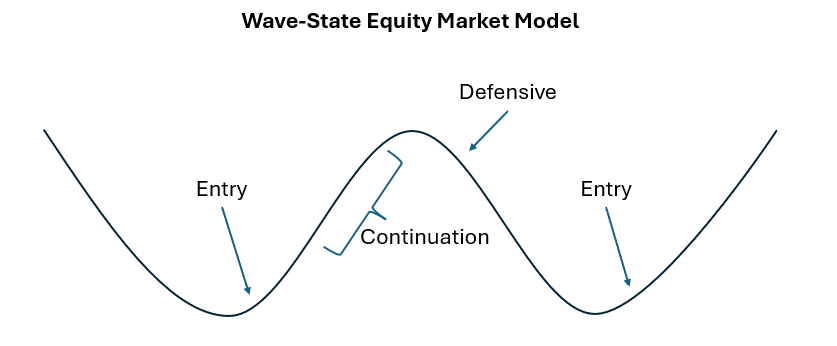
We’ve discovered that U.S. Equity Markets move in defined, observable waves. These waves turn market noise into a clear signal.
Red Oak Quant’s Wave-State Model is built to recognize where we are in each wave cycle and adjust portfolio exposure accordingly.
This is more than a simple oscillator or off-the-shelf indicator. The Wave-State Model is a proprietary, rules-based framework built from multiple signals and tested across ten years of historical data.
Each day, our system analyzes the internal structure of the market: breadth, momentum, and volatility across major U.S. equity indexes.
It classifies conditions into one of three “wave-states”:
Bullish Entry
Bullish Continuation
Defensive
Instead of guessing headlines or trading every wiggle, the Wave-State Model uses a consistent, rules-based process to align portfolio construction with where we are in the current market wave.
Subscribe to the free weekly newsletter to have our wave-state analysis delivered to your inbox.


